Computer Science major Shane Knopp ’23, from Palm Beach, Fla., describes his geological research on the Alaskan Subduction Zone.
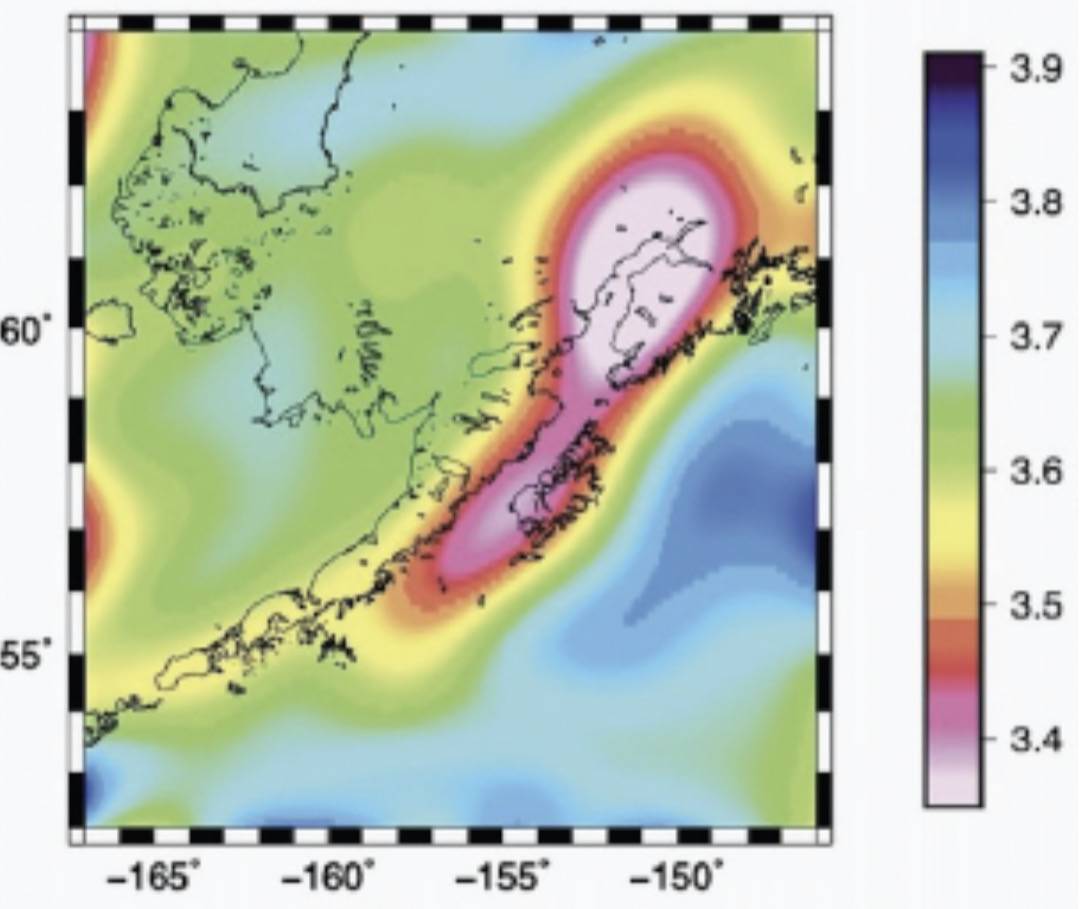
No, the image you’re looking at isn’t 20th-century abstract art. It’s actually a CT scan of Alaska, almost five years in the making, thanks to the efforts of a group of geology and computer science undergraduates and professionals. This map is just one of many insights emerging from a summer research project investigating unanswered questions about earthquake generation. And, yes, those vibrant colors have meaning.
First, some background.
The Alaskan Subduction Zone, an area where one tectonic plate slides beneath another, is part of the Pacific Ring of Fire, one of the most seismically active regions on the planet. However, the locations of earthquakes along this zone in Alaska aren’t evenly distributed. One section frequently generates earthquakes sometimes barely felt at the surface. Another segment produces damaging earthquakes over long timescales, including the planet’s second-largest ever in 1964. The fascinating question here is, “Why do different parts of the same plate exhibit such variation?” In our project, we use computed tomography to see beneath the crust to investigate earthquake dynamics and seismic hazard risk management.
What is tomography?
If you’ve heard of medical CT scans, you already understand a lot about seismic tomography. Just as human CT scans are a noninvasive way to produce detailed 3D images of the internal human body, seismic tomography allows us to see deep into the Earth in three dimensions. Instead of using light waves as the power source, we use the waves created by earthquakes.
This is where computer science meets geology.
Very sensitive seismometers record ground motion to collect earthquake data in digital form. Say goodbye to old-fashioned seismographs on paper. What makes our study interesting is the use of ocean-bottom seismometer data collected by the Alaskan Amphibious Community Seismic Experiment. This summer, we’re digitally cleaning the data by eliminating any unnatural anomalies and ambient noise (recorded signals that are not earthquakes).
Now, back to that colorful image.
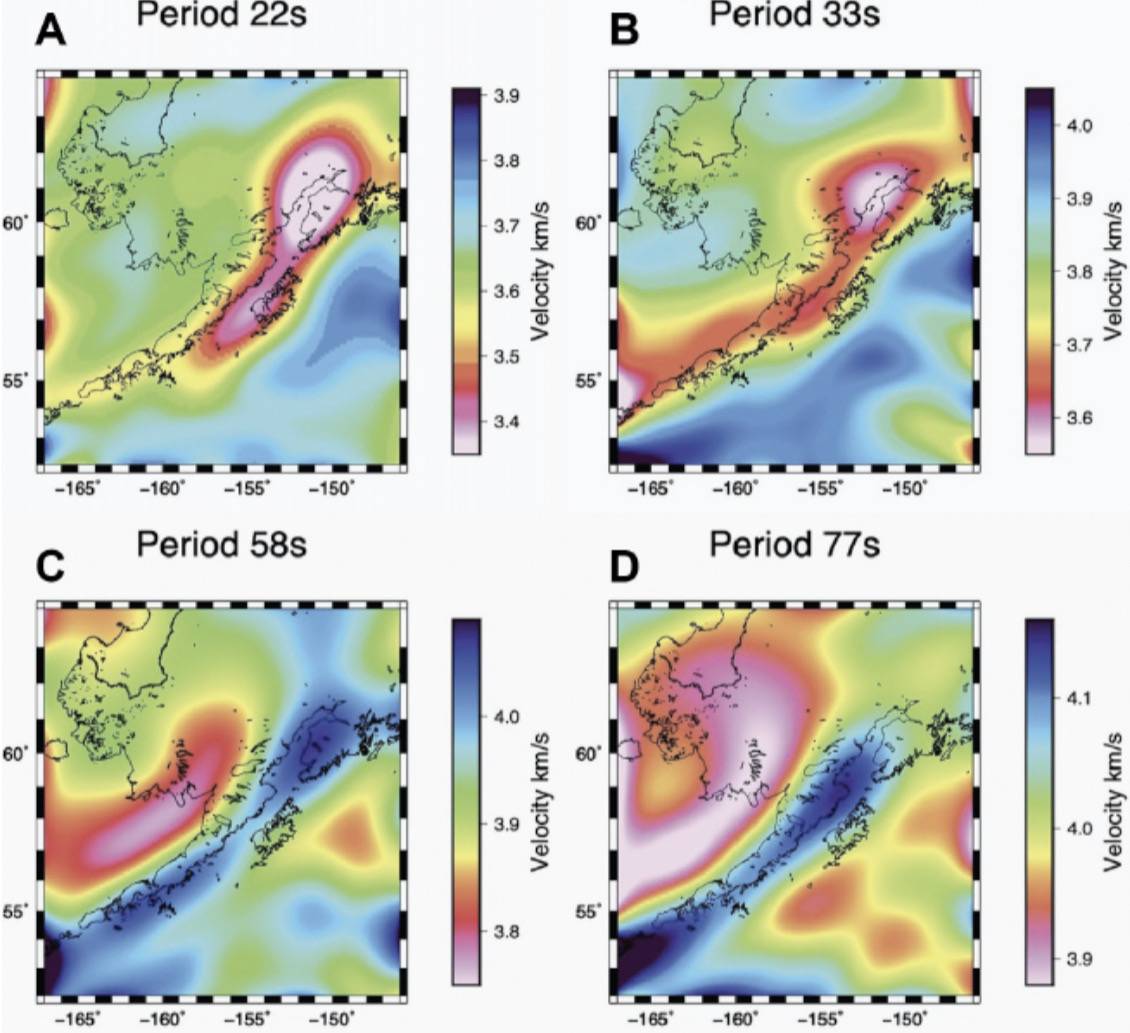
The images above are CT scans depicting the velocities of seismic waves in Earth’s interior. Slower velocities (red/pink areas in A and B) show where the crust is thick or hot, signifying mountainous and volcanic regions. Faster velocities (dark blue in C and D) indicate where the crust is cold or old, in this case, the subducting plate. It’s important to note that these results alone can’t necessarily explain the earthquake generation patterns we see in Alaska.
We’re playing the long game.
As we work through the summer and into the coming years to understand the mystery of the Alaskan Subduction Zone, our model will be refined, incorporating additional data and tuning initial parameters, with the goal of creating more accurate maps of the subsurface. Our results will be combined with complementary data from a partner project to determine how wave velocities change with the direction of travel. Then, we can infer the chemical properties of the subducting plate. These might include hydrous minerals, lubricating the interface and consequently creating an area with frequent small earthquakes.
Special thanks to everyone who I have worked with on this project:
- Professor Aubreya Adams
- Postdoc Cristo Ramirez
- Sydney Walters ’22
- Alexa Trubiano ’23
- Tom Richards ’24
- Jessica Wen ’24