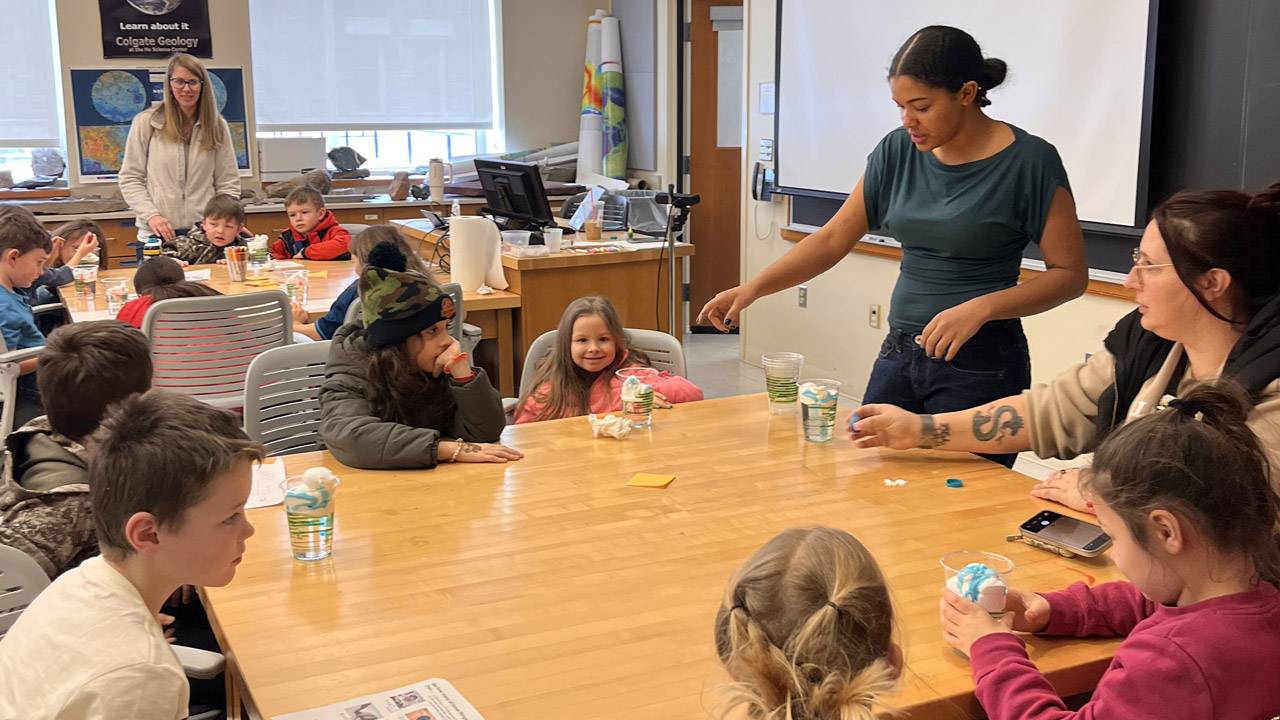
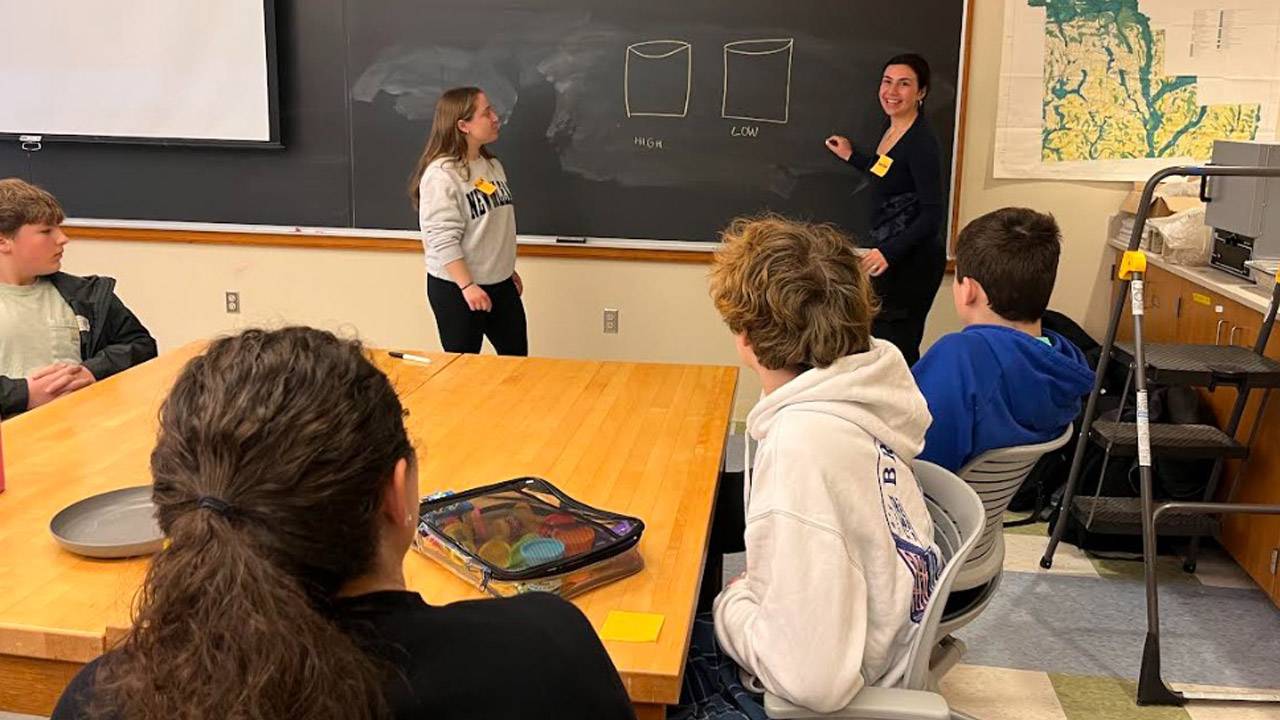
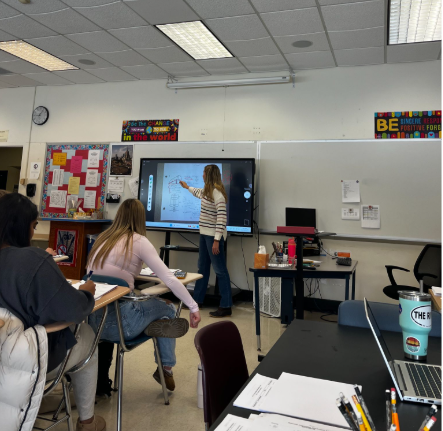
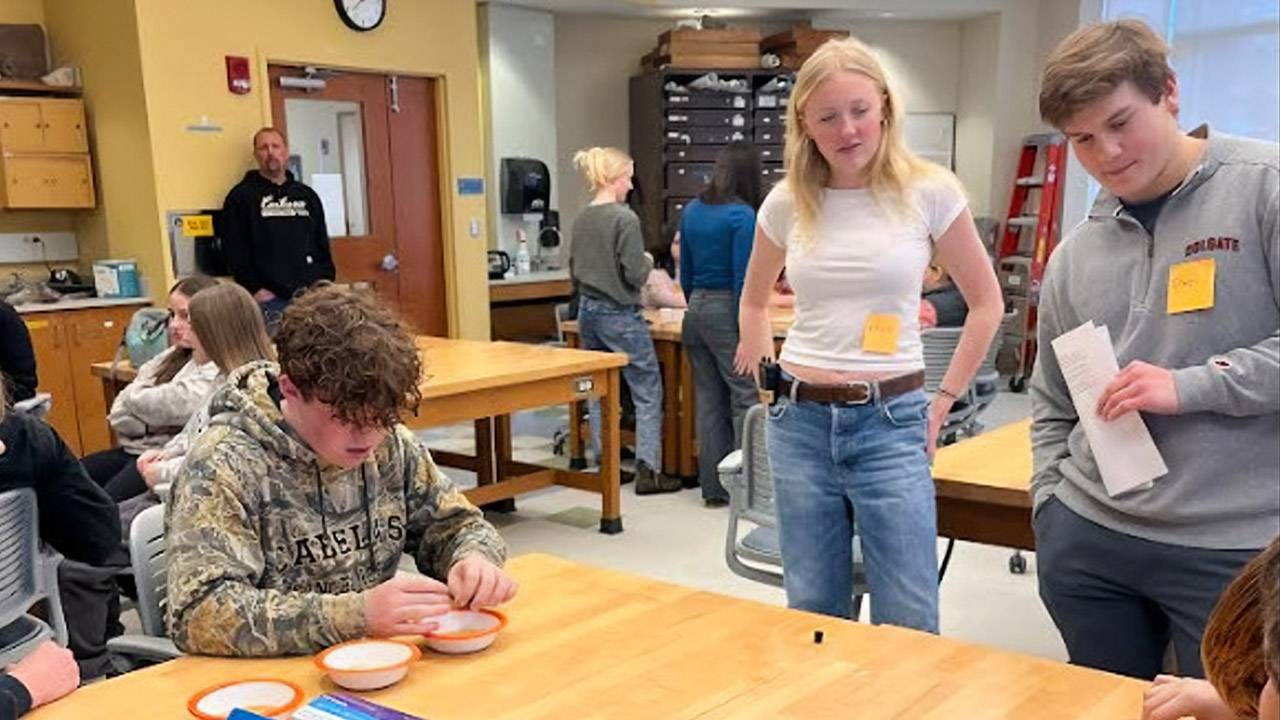
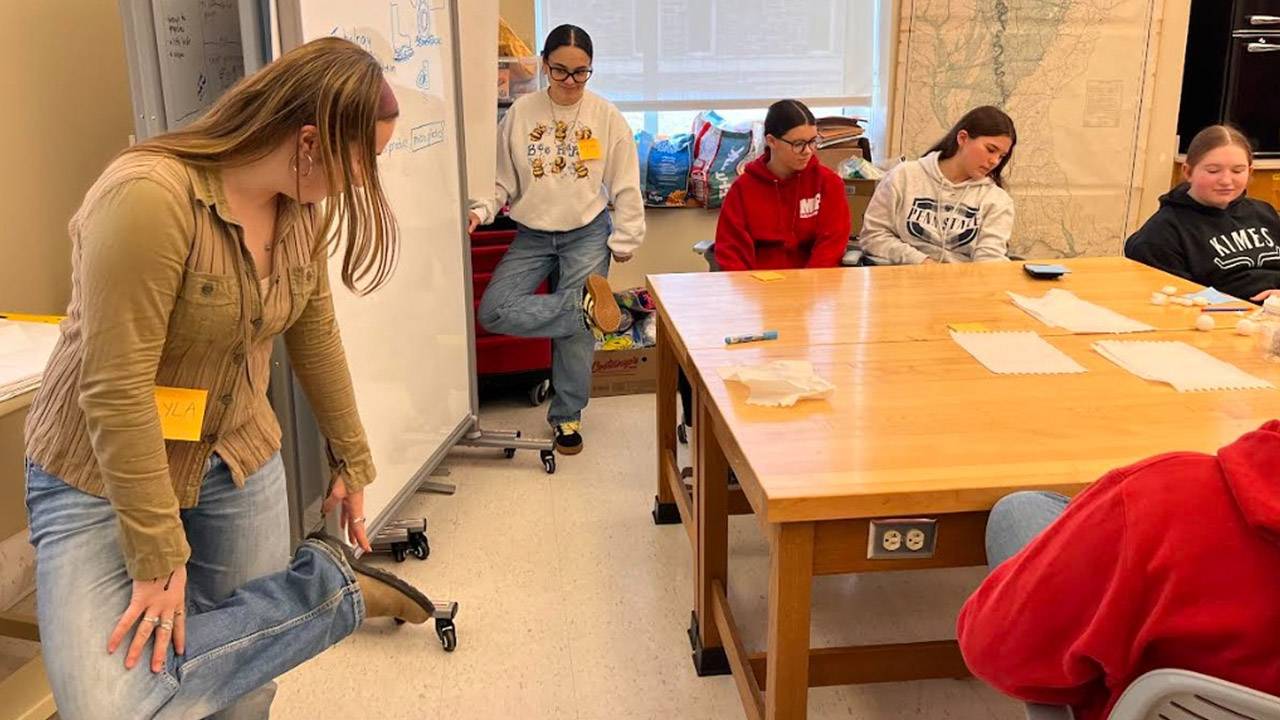
The program is not only for earning certification, but to truly learn what it means to be a teacher.

student teacher and teacher in the classroom

Our Emphasis

The program encompasses liberal studies in education as well as studies and experiences designed to develop teaching effectiveness and professional leadership. The teaching certification program emphasizes developing students’ ability to relate knowledge and theory to skillful teaching in the interest of promoting greater social justice and environmental sustainability.

at fishery gathering fish eggs
Fall 2022 student teachers at a local aquaculture center for the Teacher Preparation Program's new trout in classrooms program.

The Teacher Preparation Program (TPP)

Colgate students have the ability to obtain a New York State Department of Education teacher certification at the University. Undergraduates can complete the program in either eight or nine semesters. The ninth semester is the student teaching semester and is tuition free. Colgate also offers graduate degrees with certification. 

our 2022 MAT students

Master of Arts in Teaching

To enter the teaching certification program as a Colgate undergraduate, students first consult with the Director of Teacher Preparation and acquire an application form. Once the application is successfully reviewed, the teacher candidate can start the steps necessary to obtain a New York State Department of Education teacher certification.

The program offers teaching certification programs in the following areas (click on the photos for more information):

Student Teaching

Acceptance into the teaching certification program means candidates are tentatively approved for student teaching, but does not guarantee final acceptance. Acceptance is contingent on faculty agreement of competence, feedback from community partners during practicum and observation experiences, as well as GPA. The program makes every effort to place students in a location that will prepare them most closely with their future employment goals.

teacher and student teacher

Call for Third-Party Comment

Submission Deadline: January 26, 2022

On February 24-25, Colgate University will host an accreditation visit by the Association for Advancing Quality in Educator Preparation (AAQEP). In preparation for the visit, the AAQEP Quality Review Team is soliciting public comment about the quality of educator preparation provided by Colgate University. All comments must be submitted by January 26, 2022 through the AAQEP website: Submit Comment

More Information

Candidates for teacher certification in New York State must pass competency examinations prepared by the state education department. 

Certification is available to U.S. citizens and to non-citizens who have completed a letter of intent to become a U.S. citizen.

Teacher Spotlight

Here are some Colgate students who have completed the Teacher Preparation Program and are now teaching at schools.

All candidates in the State of New York are required to complete the Education Teacher Performance Assessment (edTPA). Colgate University has an exemplary pass rate for this evaluation. To view scores by cohort (see edTPA Charts below).

Undergraduate Elementary

Cohort n Total Ave/Rubric Planning (5) Instruction (5) Literacy Assessment (5) Math Assessment (3)
2017 2 57.5 3.2/5 16 15.5 17.5 8.5

Undergraduate Secondary (English, Language Arts, History, Social Studies, Math, Science, and World Languages)

Cohort n Total Ave/Rubric Planning (5) Instruction (5) Assessment (5)
2016 1 59 3.9/5 19 21 19

MAT Secondary (English, Language Arts, History, Social Studies, Math, Science, and World Language)

Cohort n Total Ave/Rubric Planning (5) Instruction (5) Planning (5)
2016 1 45 3.0/5 13 15 17
2017 1 57 3.8/5 20 18 19
2018 2 49.5 3.3/5 16.5 16.5 17.5

Teacher candidates are supervised during their student teaching experiences by a University Supervisor and a Cooperating Teacher. The University Supervisor completes an assessment of the candidates performance in the classroom 4 times during his or her student teaching experience. The Cooperating Teacher also completes a mid-term and summative evaluation of each candidate. This assessment is based on the Interstate Teacher Assessment and Support Consortium (InTASC) standards. Scores for candidates in the last two academic years are posted below (clinical experience).

Undergraduate Elementary

Semester Group Average Observation Mid-Term Evaluation Summative Evaluation
Fall 2017 Formative 2.16 2.3
Fall 2017 Summative 2.91 2.83
Fall 2018 Formative 2.78/4 3.03/4
Fall 2017 Summative 3.22/4 3.48/4

Undergraduate Secondary

Semester Group Average Observation Mid-Term Evaluation Summative Evaluation
Fall 2016 Formative 2.89 n/a
Fall 2016 Summative 3.89 3.40
Fall 2017 (n/a)
Fall 2018 (n/a)

MAT Secondary

Semester Group Average Observation Mid-Term Evaluation Summative Evaluation
Fall 2016 Formative 2.11 n/a
Fall 2016 Summative 3.44 3.10
Fall 2017 Formative 3.11 3.0
Fall 2017 Summative 3.56 3.38
Fall 2018 Formative 2.94/4 3.16/4
Fall 2018 Summative 3.78/4 3.59/4
Rated
Item(s)
Total Distribution Count Average Median Mode Standard
Deviation
1 2 3 4 5
In-depth knowledge of content in my field 13 8 2 1 0 2 1.92 1 1 1.44
In-depth knowledge of instructional theory and strategies for planning instruction that supports all students in meeting learning goals 13 6 4 0 2 1 2.08 2 1 1.33
The ability to make content in my discipline accessible and meaningful for students 13 6 4 0 2 1 2.08 2 1 1.33
The skills necessary to improve students' reading, writing, speaking, listening, and language abilities 13 5 5 1 1 1 2.08 2 1,2 1.21
The ability to reflect on my work as a professional 13 9 1 0 1 2 1.92 1 1 1.54
An understanding and respect for difference in students, families, and communities 13 10 0 0 1 2 1.85 1 1 1.56
An understanding of the importance of analyzing and using educational research in my field 13 6 4 0 2 1 2.08 2 1 1.33
The ability to assess student learning, use these assessments to inform my work, and improve student learning 13 3 7 0 1 2 2.38 2 2 1.33
The ability to create a positive environment that supports learning and development for all students 13 8 2 0 1 2 2 1 1 1.52
The ability to build on students' developmental levels in designing and implementing learning experiences 13 4 3 3 3 0 2.38 2 1 1.15
The ability to demonstrate behavior that supports fairness and the belief that all students can learn 13 7 0 4 1 1 2.15 1 1 1.35
The ability to manage classrooms to promote a safe learning environment 13 4 5 2 1 1 2.23 2 2 1.19
The knowledge of a variety of teaching strategies to develop students’ critical thinking and problem-solving skills 13 5 4 2 1 1 2.15 2 1 1.23
The knowledge and skills necessary to work with English language learners in my field 13 3 2 3 4 1 2.85 3 4 1.29
The knowledge and skills necessary to work with students with disability labels in my field 13 2 3 6 1 1 2.69 3 3 1.07
An understanding of how to effectively use technology to enhance teaching and promote active engagement in learning 13 1 8 2 2 0 2.38 2 2 0.84
The ability to foster positive social interaction and active engagement among students in my classroom 13 3 5 2 1 2 2.54 2 2 1.34
The ability to implement and manage instruction in ways that actively engages students in meeting learning objectives 13 4 4 3 1 1 2.31 2 1,2 1.2
The knowledge to connect concepts and use multiple perspectives to engage learners in social analysis 13 8 2 1 0 2 1.92 1 1 1.44
Total 247 102 65 30 26 24 2.21 2 1 1.34

The Empire Center is an independent, non-partisan, non-profit think tank located in Albany, New York. Each year the group reports on teacher pay and pension based on school district. A link to this resource can be found here (SeeThroughNY).

Information about program completers' performance and employment is available in the Teacher Preparation Profile.

Year Number of
completers
Graduation
rate
Certification
rate
Final GPA
of completers
Certification test pass
rate of completers
Current
placement rate
2012–13 5 MAT 70%   3.69 100% 40% (Unverified)
2013–14 3 MAT 100%     100% 66%
2014–15 4 MAT 100%   3.75 100% 75%
2015–16 4 MAT 100%   3.8 100% 100%
2016–17 1 MAT
1 UG
100% 100% 3.53 100% 100%
2017–18 1 MAT
1 UG
1 9th semester
100% 66%   66% 66%
2018–19 4 MAT
1UG
1 9th semester
100% 33% 3.34 100% 50% (public)
66% (other)


Information about the location of program completers' employment is available in employer data.

Employer Data

Local Districts NYS Districts Other Districts
*[2015] Cazenovia High School
*[2015] Norwich Central School, HS
*[2018] Utica City School District, Jones Elementary School
*[2018] Fayetteville-Manilus School District HS
*[2019 cohort] OCM BOCES, Alternative Education
*[2019 cohort] Utica City School District, Donovan Middle School
*[2016] Bronx Center for Science
*[2016/2017] Discover High School in the Bronx
*[2017] Utrecht High School
*[2019 cohort] Bronx Charter School for Excellence
*[2016] Rising Tide Charter Public School, Plymouth, Massachusetts
*[2019] Prattville Junior HS, Montgomery, AL
*[2019] Nazareth Farm, Salem, WV