Colgate’s liberal arts approach prepares graduates for success in a wide variety of careers. Explore our students’ first post-graduate employment and continuing education outcomes.

The following dashboards will allow you to explore our most recent classes’ employment, continuing education, and competitive fellowship outcomes. 

The content displayed represents self-reported, employer-reported, or verifiable public data gathered six to nine months following students’ graduation. Our robust knowledge rates — or the percentage of graduates for whom verifiable data exists — of at least 88% of the class allow us to tell the story of our seniors’ outcomes with confidence. 
 

  2019 2020 2021 2022 2023
  Employed 2019 84.7% 2020 73.7% 2021 76.9% 2022 79.7% 202377.0%
  Graduate School 2019 12.6% 2020 18.7% 2021 21.3% 2022 17.3% 202317.4%
  Volunteer Service 2019 0.1% 2020 0.4% 2021 0.0% 2022 0.0% 20230.4%
  Fellowships 2019 0.8% 2020 0.9% 2021 0.5% 2022 0.6% 20231.2%
  Travel 2019 0.3% 2020 0.0% 2021 0.0% 2022 0.3% 20230.4%
  Other* 2019 0.4% 2020 0.8% 2021 0.5% 2022 0.2% 20231.3%
  In Transition/Seeking 2019 1.1% 2020 5.5% 2021 0.8% 2022 1.9% 20232.3%
  Total Knowledge Rate** 2019 89.2% (659/739) 2020 89.8% (658/733) 2021 88.0% (618/702) 2022 90.1% (681/756) 202392.3% (684/741)

*  Includes military service and care for family members. 
** Percentage of graduates for whom verifiable self-reported, employer-reported, or public data exists six to nine months post-graduation.

Recent Alumni Employment Locations

Review an interactive map displaying the location of the first job, graduate school, fellowship, or military service outcomes for recent alumni.

Map (2019-2023)

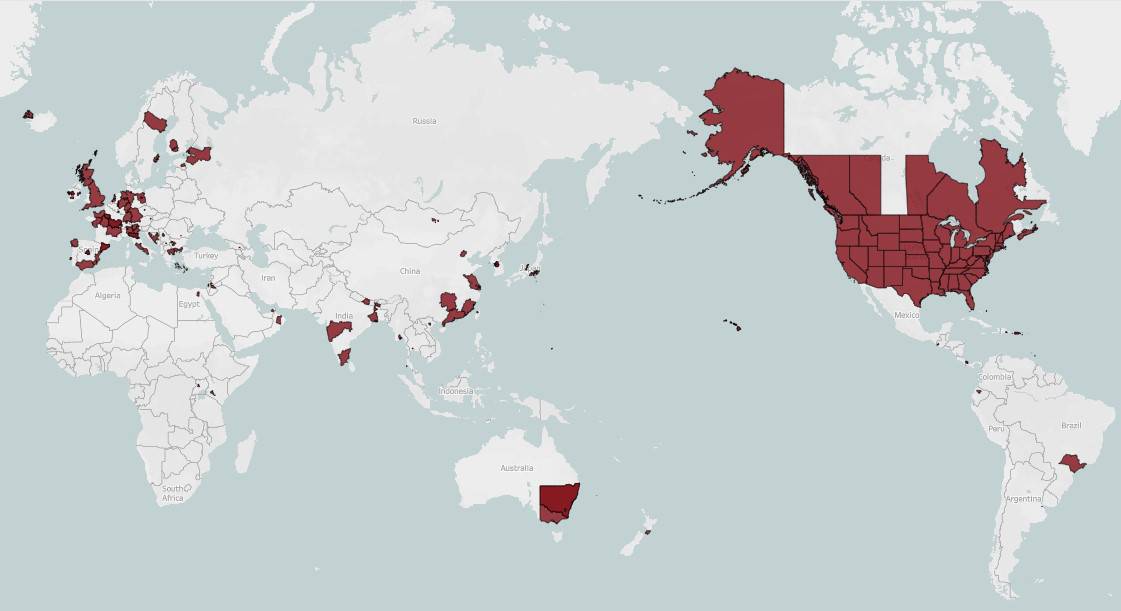
Click the image above to launch an interactive dashboard showing worldwide outcomes for employment, graduate school, national scholarships or fellowships, and military service.

Top Employer and Graduate School Information

This dashboard contains the top industries, employers, graduate areas of study, and institutions attended by members of the classes of 2019–2023. It is filterable by class year, academic division, and the academic department in which students majored or minored.

Individual Employment and Continuing Education Outcomes

This dashboard contains individual employment and continuing education outcomes for Colgate graduates from the classes of 2019–2023. It is filterable by class year, academic division, and the academic department in which students majored or minored. Results will display graduates’ employers, graduate institutions, industries, and geographic locations of their first post-graduate outcome.